สมัครเรียนโทร. 085-350-7540 , 084-88-00-255 , ntprintf@gmail.com
เรียนเขียนโปรเเกรมง่ายๆกับ Expert Programming Tutor ในบท Macchine Learnning - Scatter Plot
ในบทนี้เราจะเรียนเนื้อหาพล็อตกระจายเป็นแผนภาพที่แต่ละค่าในชุดข้อมูลถูกแสดงด้วยจุด
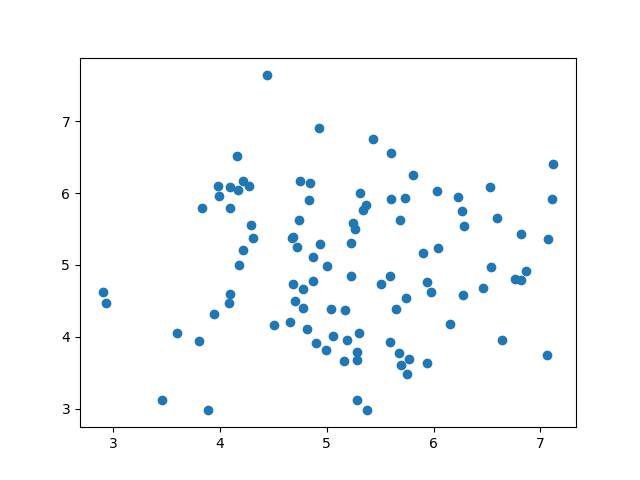
โมดูล Matplotlib มีวิธีการในการวาดแผนการกระจายมันต้องการสองอาร์เรย์ที่มีความยาวเท่ากันหนึ่งตัวสำหรับค่าของแกน x และอีกหนึ่งค่าสำหรับแกน y
|
x = [5,7,8,7,2,17,2,9,4,11,12,9,6] |
- อาร์เรย์ x แทนอายุของรถยนต์แต่ละคัน
- อาร์เรย์ y แสดงถึงความเร็วของรถแต่ละคัน
ตัวอย่าง
ใช้วิธี scatter() เพื่อวาดแผนภาพพล็อตกระจาย
|
import matplotlib.pyplot as plt |
ผลลัพธ์
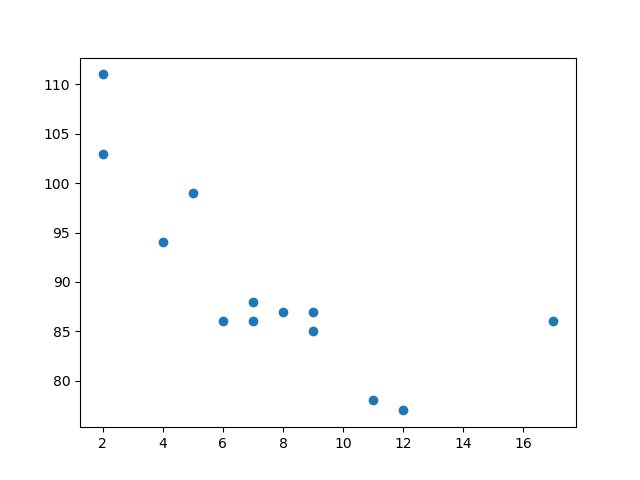
แผนการกระจายอธิบาย
แกน x แทนอายุและแกน y แสดงถึงความเร็ว สิ่งที่เราสามารถอ่านได้จากแผนภาพคือรถที่เร็วที่สุดทั้งสองคันมีอายุ 2 ปีและรถที่ช้าที่สุดคือ 12 ปี
การแจกแจงข้อมูลแบบสุ่ม
ในการเรียนรู้ของเครื่องชุดข้อมูลสามารถมีค่าหลายพันหรือหลายล้านค่า นักเรียนอาจไม่มีข้อมูลในโลกแห่งความจริงเมื่อนักเรียนกำลังทดสอบอัลกอริทึมนักเรียนอาจต้องใช้ค่าที่สร้างแบบสุ่ม
ดังที่เราได้เรียนรู้ในบทก่อนหน้านี้โมดูล NumPy สามารถช่วยเราได้! ให้เราสร้างสองอาร์เรย์ที่เต็มไปด้วย 1,000 ตัวเลขสุ่มจากการแจกแจงข้อมูลปกติ
- อาร์เรย์แรกจะมีค่าเฉลี่ยที่ 5.0 เป็นค่าเบี่ยงเบนมาตรฐานที่ 1.0
- อาร์เรย์ที่สองจะมีค่าเฉลี่ยตั้งค่าเป็น 10.0 โดยมีค่าเบี่ยงเบนมาตรฐาน 2
ตัวอย่าง
พล็อตกระจายที่มี 1,000 จุด
|
import numpy |
ผลลัพธ์
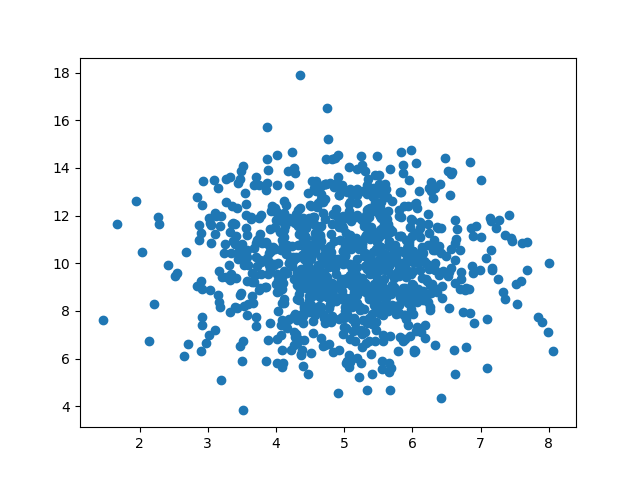
แผนการกระจายอธิบาย
- เราจะเห็นว่าจุดต่างๆ นั้นมีความเข้มข้นประมาณ 5 ตามแกน x และ 10 ในแกน y
- เราสามารถเห็นได้ว่าสเปรดนั้นกว้างกว่าบนแกน y มากกว่าบนแกน x
แปลจากhttps://www.w3schools.com/python/python_ml_scatterplot.asp
Tag ที่น่าสนใจ: machine_learning scatter_plot matplotlib data_visualization python programming numpy random_data algorithm tutorial programming_tutor
หากมีข้อผิดพลาด/ต้องการพูดคุยเพิ่มเติมเกี่ยวกับบทความนี้ กรุณาแจ้งที่ http://m.me/Expert.Programming.Tutor
085-350-7540 (DTAC)
084-88-00-255 (AIS)
026-111-618
หรือทาง EMAIL: NTPRINTF@GMAIL.COM
Copyright (c) 2013 expert-programming-tutor.com. All rights reserved. | 085-350-7540 | 084-88-00-255 | ntprintf@gmail.com